
Real-time KPIs
Live numbers instead of last month's spreadsheet.
Business intelligence
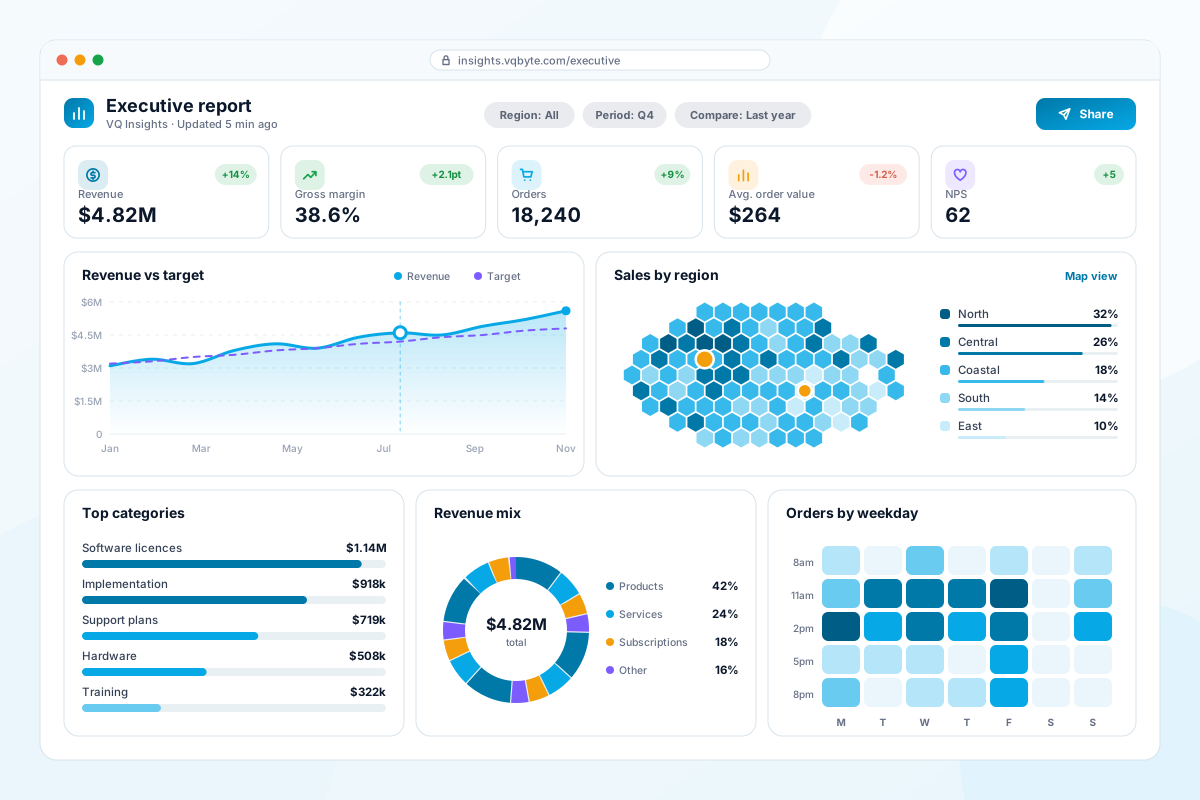
Bring your sales, finance, inventory and operations data together into dashboards your managers will actually open. Clear KPIs, drill-downs to the source and automatic reports in your inbox.
Sound familiar?
If any of these describe your business today, you're in the right place.
Business outcomes
Live numbers instead of last month's spreadsheet.
Agreed KPI definitions so everyone trusts the numbers.
Alerts when a metric crosses a threshold.
Automated reports replace manual compilation.
Features
Every solution is configured to your workflow — choose what you need now and add more as you grow.
Revenue, margin, cash and growth at a glance.
Orders, stock, production and delivery performance.
Pipeline, conversion, targets and team performance.
A clean, central store combining all your sources.
Power BI, Looker Studio or embedded custom dashboards.
PDF and Excel reports delivered automatically.

How we deliver
We connect your sources, clean and model the data, agree KPI definitions with you and design dashboards for each role.
Our process
A clear, step-by-step process so you always know what happens next.
A free 30-minute call to understand your business, goals and the problem to solve.
We map your processes and send a fixed-scope proposal with price, phases and timeline.
You see and click through screens before development starts, so there are no surprises.
We deliver in short sprints with a working demo every two weeks.
We move your data, test real scenarios with your team and train every role.
Go-live support, monitoring and a monthly plan for improvements and growth.
Industries
We tailor every project to the way your sector works.
Fuel & lubricant distributors · Petrol / filling station networks · LPG & CNG distribution
See solutionsDiscrete manufacturing · Process & batch manufacturing · Food & beverage processing
See solutionsFashion & apparel · Electronics & mobile shops · Supermarkets & grocery
See solutionsFMCG distributors · Building materials suppliers · Electrical & hardware wholesalers
See solutionsFAQ
Not necessarily. We work with Power BI and Looker Studio, or build dashboards directly into your own application when licensing or embedding needs make that the better choice.
Cost depends on the number of users, modules, integrations, data migration and how much is custom. After a free discovery call we send a fixed-scope proposal with a clear price, timeline and phases, so there are no surprises.
Focused projects usually go live in 4–8 weeks. Larger multi-module or multi-location rollouts are delivered in phases, with the first phase typically live within 8–12 weeks so your team sees value early.
Yes. Every project includes a post-launch support period, and we offer monthly support and improvement plans covering fixes, updates, monitoring, training and new features.
Related services
Custom ERP software for small, mid-sized and enterprise businesses.
Learn moreConnect your ERP, CRM, e-commerce, accounting, payment and messaging systems.
Learn moreCustom CRM software to manage leads, sales pipelines, customer support and WhatsApp conversations.
Learn moreCustom software development for businesses that have outgrown spreadsheets and off-the-shelf tools.
Learn moreFree consultation
Book a free 30-minute consultation. We'll listen, ask the right questions and suggest the fastest way to solve your problem — no obligation.